Stress Testing Matrix
Systematic concurrency tier analysis to identify performance thresholds, breaking points, and optimal operating ranges for your infrastructure.
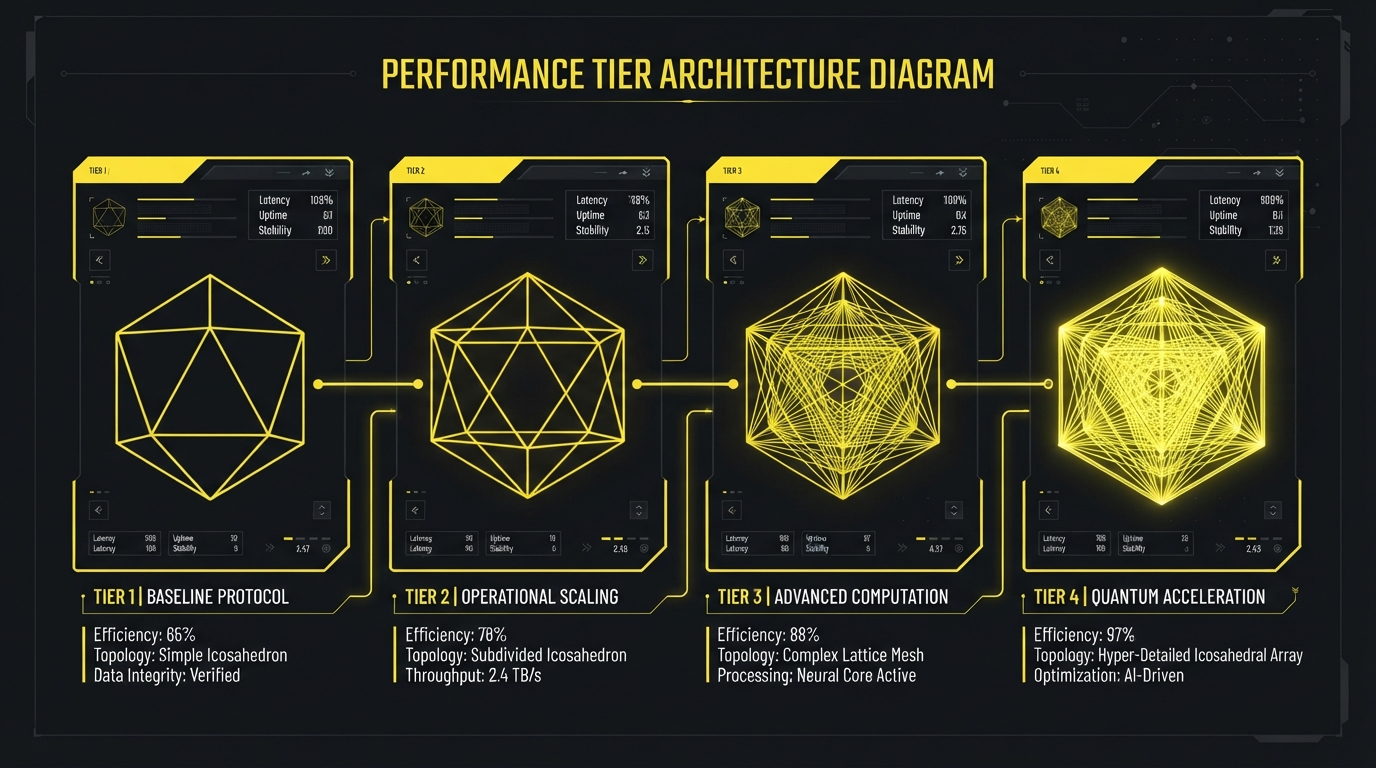
Concurrency Tiers
Progressive load testing from baseline to break point
Tier 1 - Baseline
Initial capacity validation and smoke testing
Tier 2 - Production Load
Simulate peak production traffic patterns
Tier 3 - Stress Test
Identify breaking points and resource limits
Tier 4 - Break Point
Determine absolute system capacity limits
Tier Comparison Matrix
Detailed performance metrics across all concurrency tiers
| Metric | Tier 1 | Tier 2 | Tier 3 | Tier 4 |
|---|---|---|---|---|
| Response Time | 120ms | 280ms | 850ms | 2.1s |
| Throughput | 1,200/s | 5,400/s | 22,000/s | 48,000/s |
| Error Rate | 0.02% | 0.15% | 1.2% | 4.8% |
| CPU Usage | 28% | 52% | 76% | 94% |
| Memory | 2.1GB | 4.8GB | 8.2GB | 12.4GB |
| DB Connections | 45 | 120 | 280 | 450 |
Testing Methodology
Progressive Load Ramp
Gradually increase concurrency from baseline to break point, capturing metrics at each tier to identify performance degradation patterns and resource saturation points.
Percentile Analysis
Track P50, P95, and P99 latency percentiles to understand tail latency behavior and identify outliers that impact user experience.
Failure Mode Detection
Monitor error rates, timeouts, and resource exhaustion to identify failure modes and provide actionable recommendations for capacity planning.
Ready to Map Your Stress Matrix?
Get a comprehensive tier analysis for your infrastructure.
Book a Stress Test